
TUESDAY, 31 MAY 2022
Central London Property Market Enjoys a Spring Boost
The first quarter (Q1) figures for 2022 have produced some encouraging signs of recovery for prime London property prices and central London lettings. Over the last three years, property prices have risen by 10.9 per cent, to just 4.4% below their previous peak in 2016. Recently we have seen more sale properties go under offer – a positive indicator of overall market health. At the same time, the London rental market has bounced back triumphantly, breaking LonRes records.
Sales Market Update
Prices in the three prime LonRes areas (prime central London, prime London and prime fringe) increased by an impressive 5.2 per cent over the year to Q1 2022. The highest growth recorded, at 6.8 percent, was for house prices in prime central London, while prime fringe came in at 2.5 per cent.
However, the latest quarterly figures for the London residential property market show that overall annual growth has slowed, with a slight fall of 0.02 per cent.
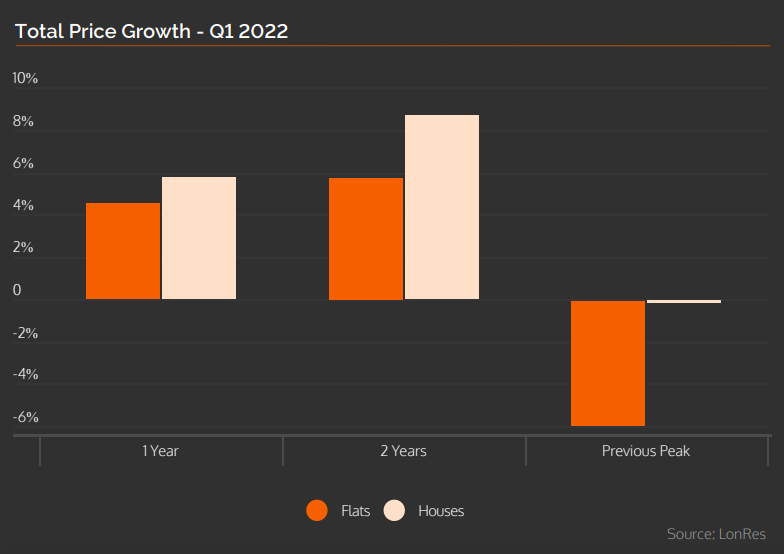
Contrast Between Flats and Houses
This dip in growth is the result of the continuing imbalance between the cost of flats and houses. During the pandemic, home seekers prioritised properties with home offices and outdoor space, and this trend continued after restrictions were lifted.
Both flats and houses have shown broadly similar growth levels over the past year (4.5 percent for apartments and 5.7 per cent for houses). However, the disparity between both property types becomes clearer when the statistics are compared with the previous market peak of 2016. House prices are now just one per cent below the 2016 peak, while flats remain almost 6 per cent below.
A Difference in Transaction Volumes
This year’s data may look less impressive without the inflated figures created by the 2021 Stamp Duty Holiday, but house transactions have exceeded expectations. The Q1 2022 transaction figures are just 0.9 per cent lower than the last peak in late 2013, although flats still lag behind the previous peak of early 2014, at minus 27 percent.
Sales have now reached levels similar to pre-pandemic averages. However, the number of homes that have recently gone under offer suggests that transaction figures will rise in the coming months.
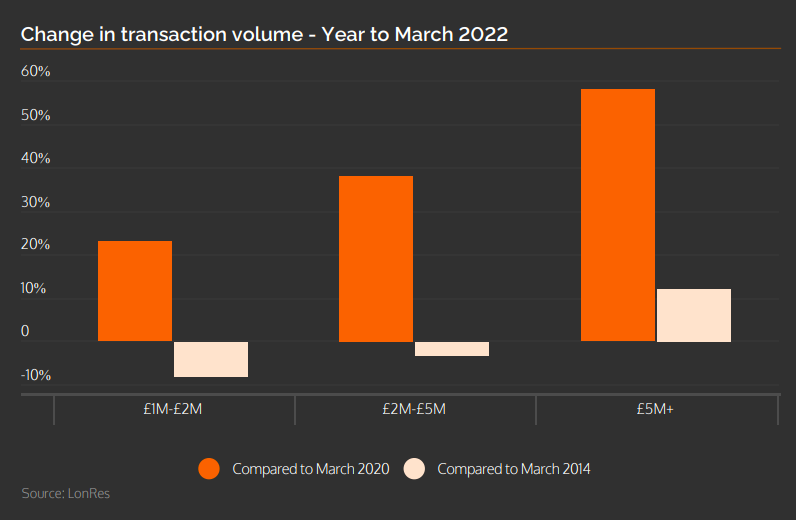
The chart below shows that price bands were also subject to variation. Transactions at the top end of the market were 58 per cent higher than those recorded just before the pandemic. They were also 10 per cent higher than the figure noted at the previous peak in 2014.
Activity levels for lower priced properties have also recovered well when compared with pre-pandemic figures, and current figures show they are just below their previous peak.

Lettings Market Update
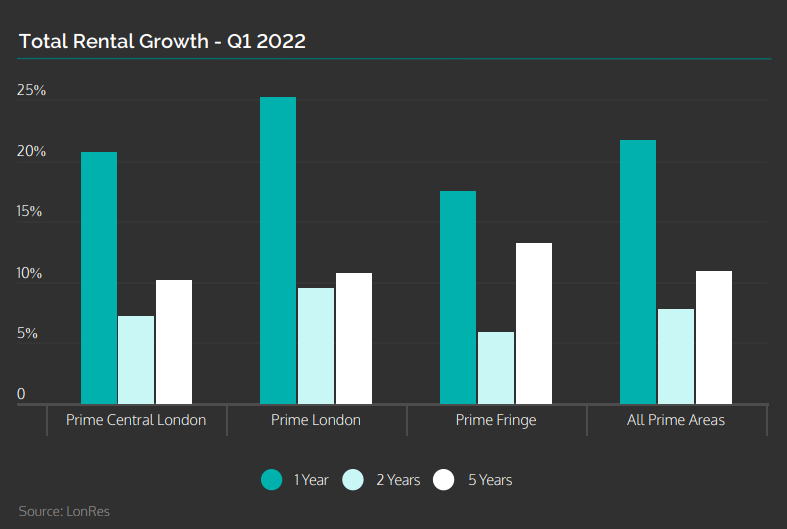
The lettings market has seen exponential growth throughout the UK – largely driven by a lack of rental stock. The same is true for London rental properties, where demand has bounced back after a short-lived, pandemic-driven exodus. This has resulted in an overall annual growth rate of 22 per cent across all three areas of the prime London property market.
As the chart above shows, in Q1 2022, annual rental growth rates averaged 25 per cent in prime London, 20 per cent in prime central London and 19 per cent in prime fringe.
An Exponential Rise and Robust Demands
Rents have achieved new record highs, topping previous peaks recorded in Q2 2007 (19 per cent) and Q3 2010 (16 per cent). However, these remarkable rates must be considered against the backdrop of the substantial falls experienced during the pandemic.
As Q1 2022 figures show a 4.4 per cent rise in rents across all prime areas, rents are expected to remain at a higher level than those recorded before the pandemic.
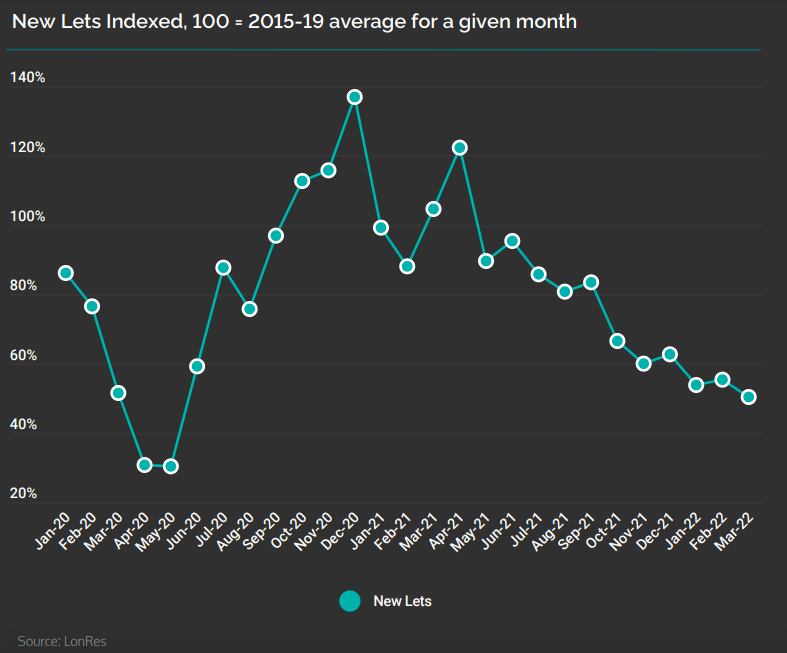
The demand from tenants remains strong. In the six months up to March 2022, properties were, on average, let in 45 days. In the same period the year before, properties remained on the market for 89 days. But as the chart below shows, the lack of rental stock is causing an issue with turnover in the rentals market, and new lets are down by 46% compared to the pre-pandemic average.
To sum up, after a busy 2021, the market has continued to strengthen, with overall activity returning to pre-pandemic levels. The latest survey from the Royal Institution of Chartered Surveyors reveals that the UK housing market is currently in excellent health, although activity could begin to slow if mortgage rates continue to rise.

If you are looking to buy, rent or invest in London property this year, why not contact one of our expert advisors?